Thanh Khoản (Liquidity): Khái niệm cốt lõi tối thượng của phương pháp ICT
Trong phương pháp phân tích của Michael J. Huddleston, có một chân lý bất biến: "Thị trường tài chính không di chuyển vì chỉ báo hay đường xu hướng, thị trường di chuyển vì THANH KHOẢN (LIQUIDITY)." Thanh khoản chính là nguồn nhiên liệu duy nhất nuôi dưỡng thuật toán IPDA.
1. Thanh Khoản Thực Chất Là Gì Trong Trading?
Nhiều người nghĩ thanh khoản là khối lượng giao dịch. Nhưng trong ICT, Thanh khoản là nơi tập trung các lệnh chờ (Pending Orders) và lệnh dừng lỗ (Stop Loss) của đám đông nhỏ lẻ.
Thuật toán định giá liên ngân hàng luôn có xu hướng đưa giá tìm về các vùng thanh khoản này để kích hoạt lệnh của đám đông, tạo ra thanh khoản đối ứng cho các tổ chức ngân hàng lớn gom/xả hàng.
2. Hai Phân Loại Thanh Khoản Quan Trọng Nhất
📈 Buy-side Liquidity (BSL — Thanh Khoản Phe Mua)
Nằm ở phía trên các đỉnh cũ (Old Highs), đỉnh ngày cũ (Previous Day High - PDH), đỉnh tuần cũ (PWH) hoặc các cụm đỉnh bằng nhau (Equal Highs - EQH).
Bản chất bên trong: Đây là nơi chứa lệnh Dừng lỗ của phe Bán (Buy Stop) và lệnh Mua đuổi breakout của trader nhỏ lẻ. Khi giá quét qua BSL, Smart Money sẽ dùng chính những lệnh Mua này để khớp các lệnh BÁN khổng lồ của họ.
📉 Sell-side Liquidity (SSL — Thanh Khoản Phe Bán)
Nằm ở phía dưới các đáy cũ (Old Lows), đáy ngày cũ (Previous Day Low - PDL), đáy tuần cũ (PWL) hoặc các cụm đáy bằng nhau (Equal Lows - EQL).
Bản chất bên trong: Đây là nơi chứa lệnh Dừng lỗ của phe Mua (Sell Stop) và lệnh Bán tháo phá vỡ. Khi giá quét thủng SSL, Smart Money sẽ gom toàn bộ các lệnh Bán giá rẻ mạt này để MUA vào với vị thế lớn.
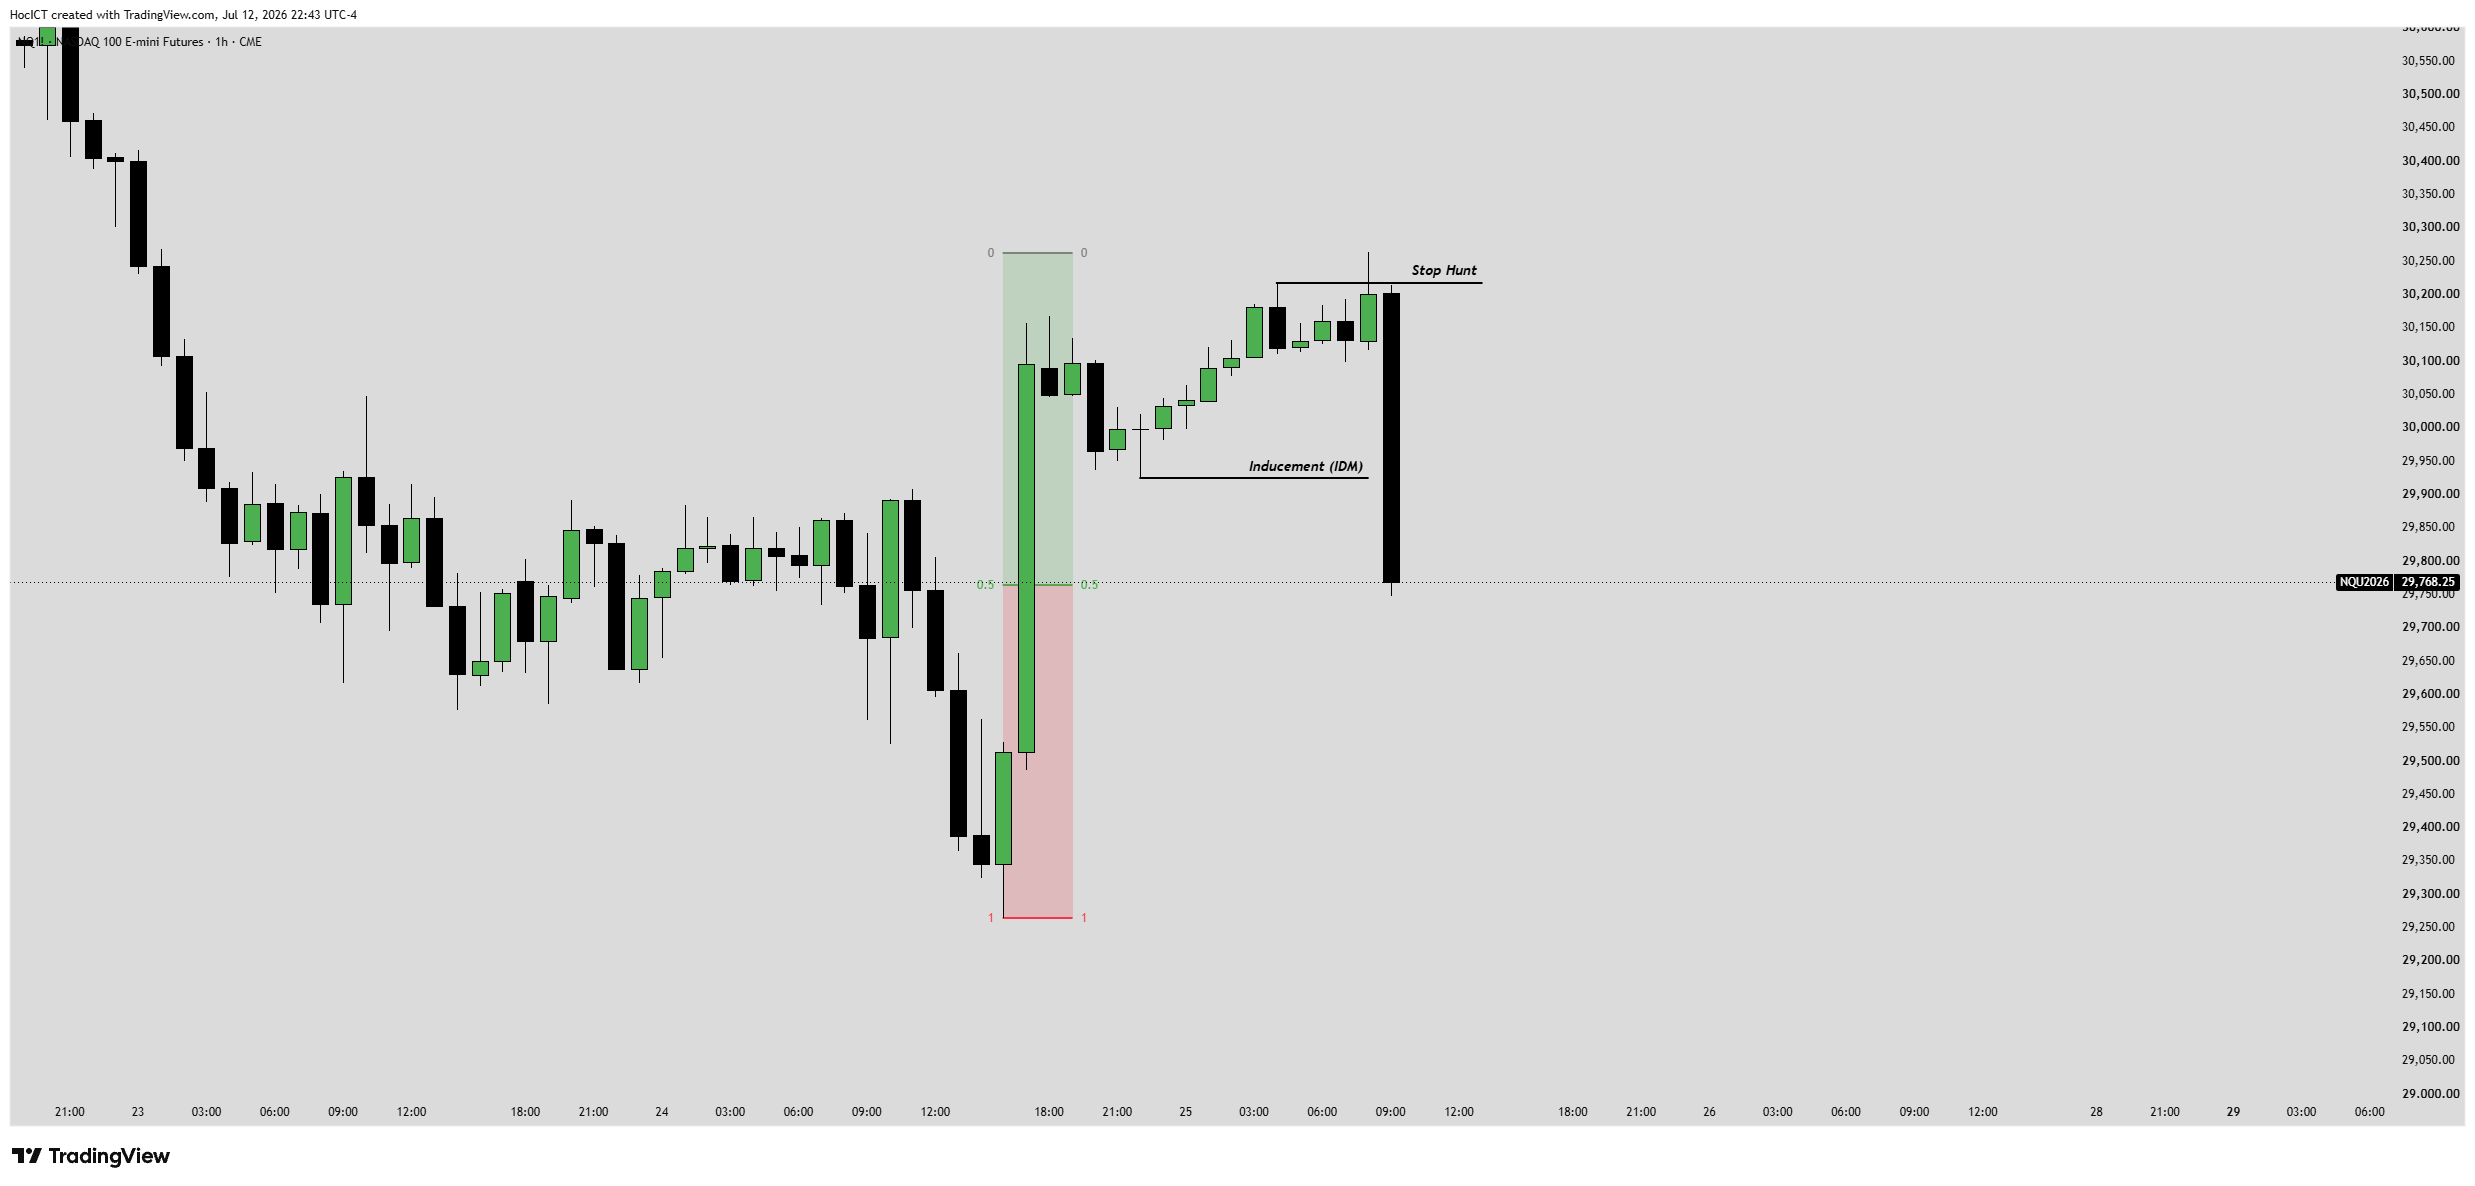
📷 Minh họa 1.1: Nhịp quét thanh khoản (Stop Hunt) tại đỉnh cũ kết hợp bẫy dụ dỗ Inducement (IDM) thực tế trên biểu đồ Nasdaq.
3. Vòng Tuần Hoàn: Từ Thanh Khoản Nội Vùng (IRL) Sang Ngoại Vùng (ERL)
Quy luật phân phối lệnh của IPDA là một vòng tuần hoàn khép kín:
- External Range Liquidity (ERL): Thanh khoản nằm ở các đỉnh/đáy cực trị bên ngoài phạm vi dao động.
- Internal Range Liquidity (IRL): Các vùng mất cân bằng (FVG) nằm ở bên trong phạm vi dao động.
"Nguyên lý vận hành: Sau khi IPDA quét sạch thanh khoản bên ngoài ERL (Stop Hunt), nó sẽ đưa giá quay trở lại lấp đầy thanh khoản nội vùng IRL (FVG) và ngược lại."
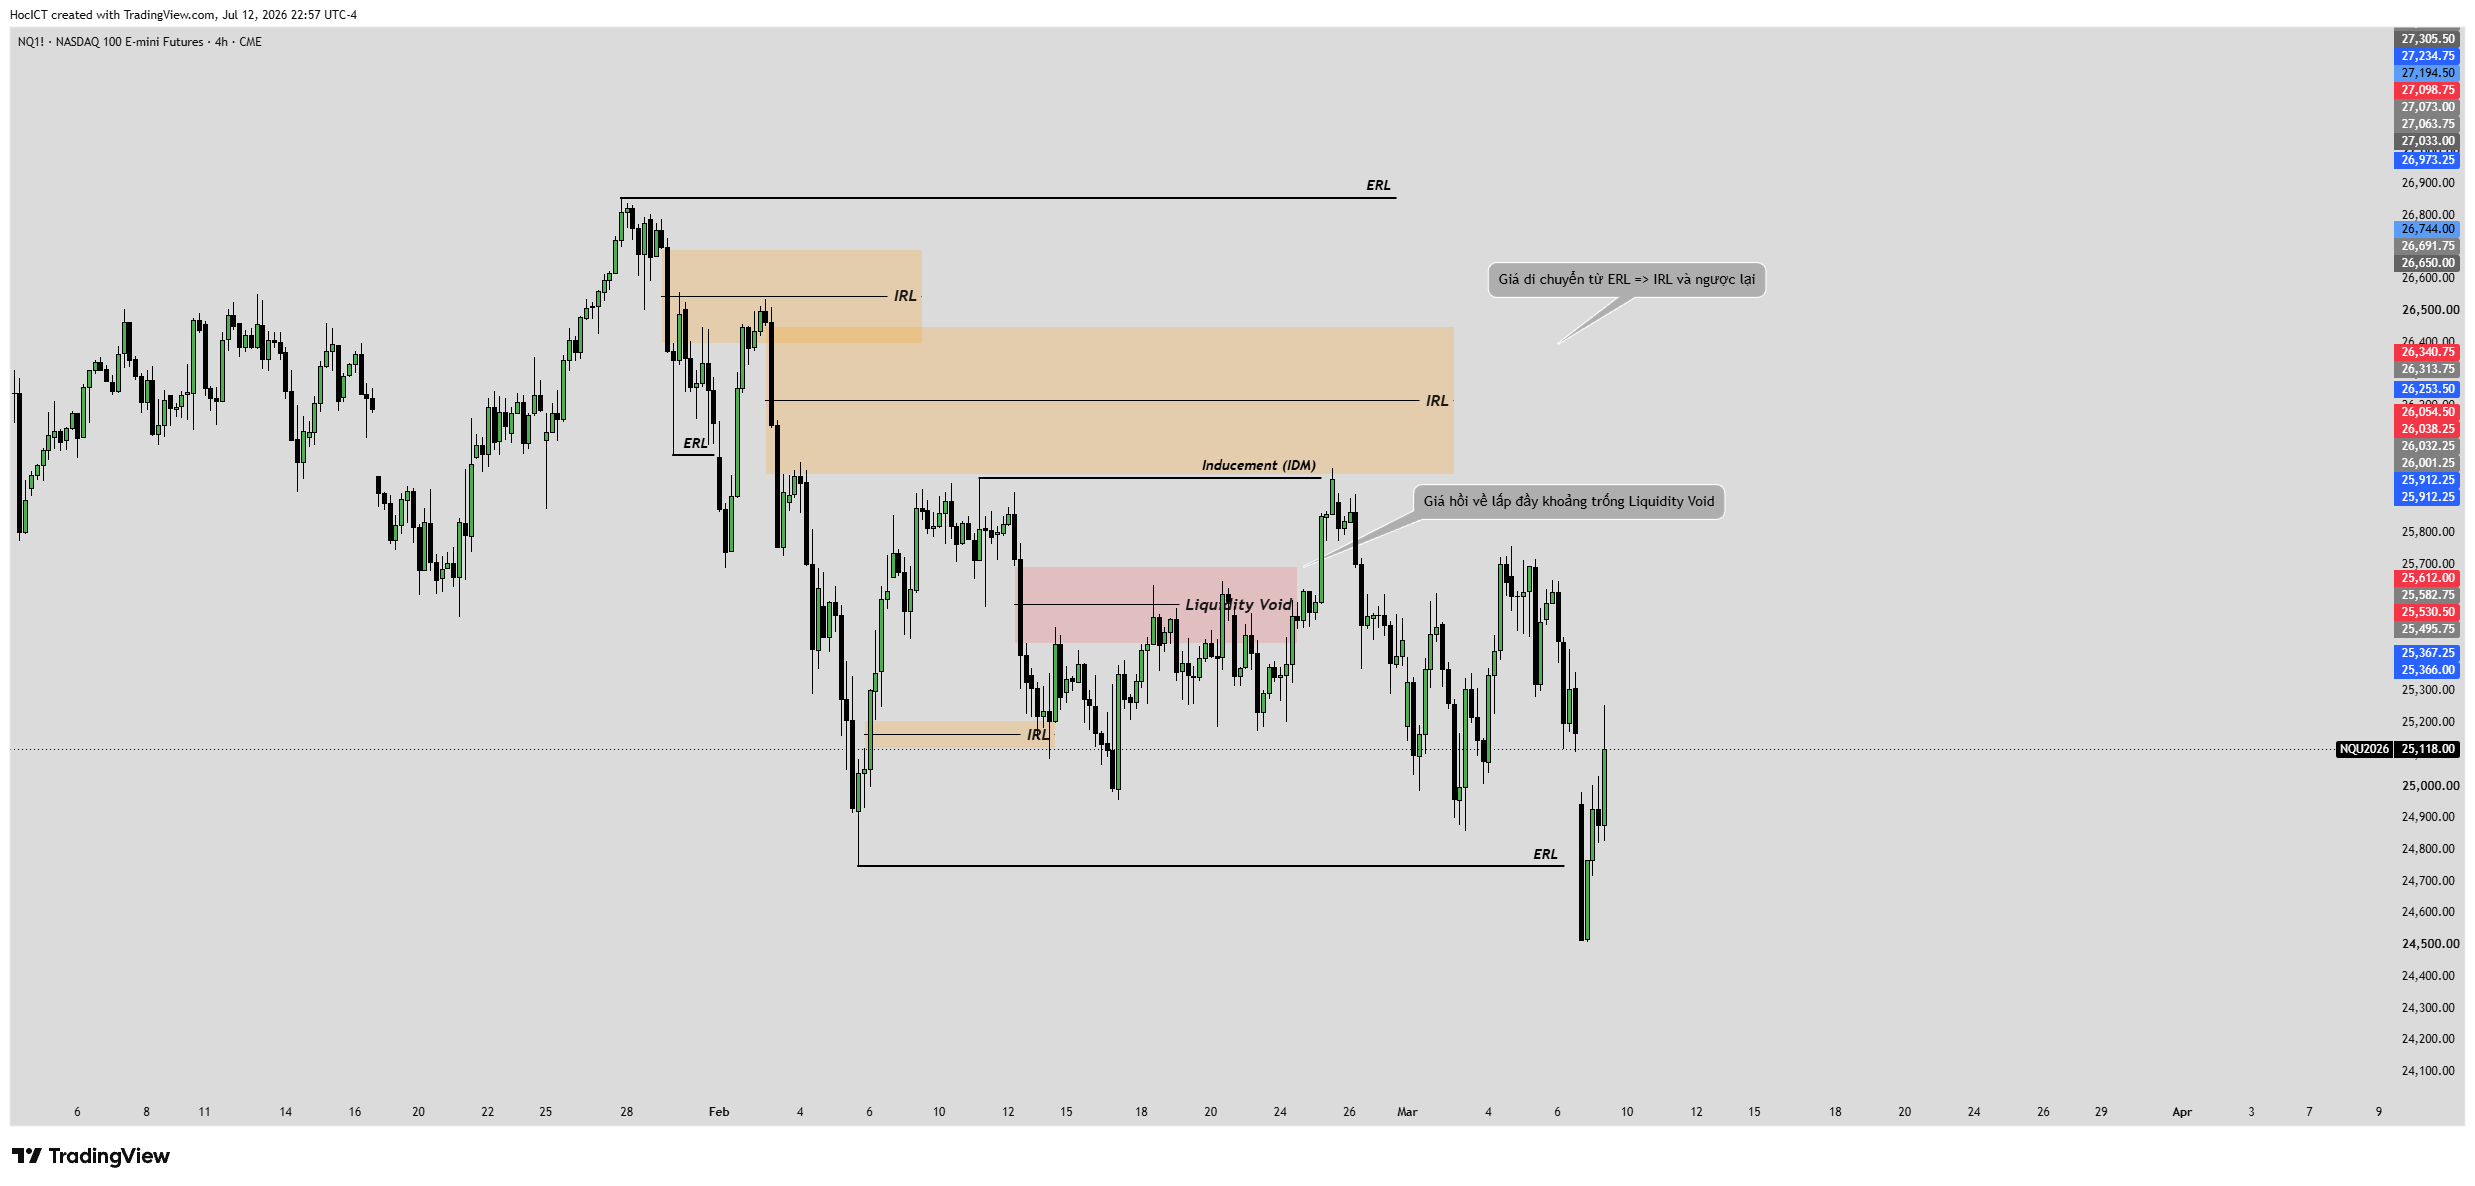
📷 Minh họa 1.2: Chu kỳ dịch chuyển của giá giữa thanh khoản nội vùng (IRL) và thanh khoản ngoại vùng (ERL) thực tế trên biểu đồ.
Trắc Nghiệm Kiến Thức: Thanh Khoản (Liquidity): Khái niệm cốt lõi tối thượng của phương pháp ICT
Trả lời 3 câu hỏi trắc nghiệm thực chiến để củng cố kiến thức vừa học.