Mô hình giá⏱️ 13 phútChương 3.2 — Mô Hình Giao Dịch (PO3 / AMD)
AMD Model: Mô hình giao dịch 3 pha hoàn chỉnh theo ICT
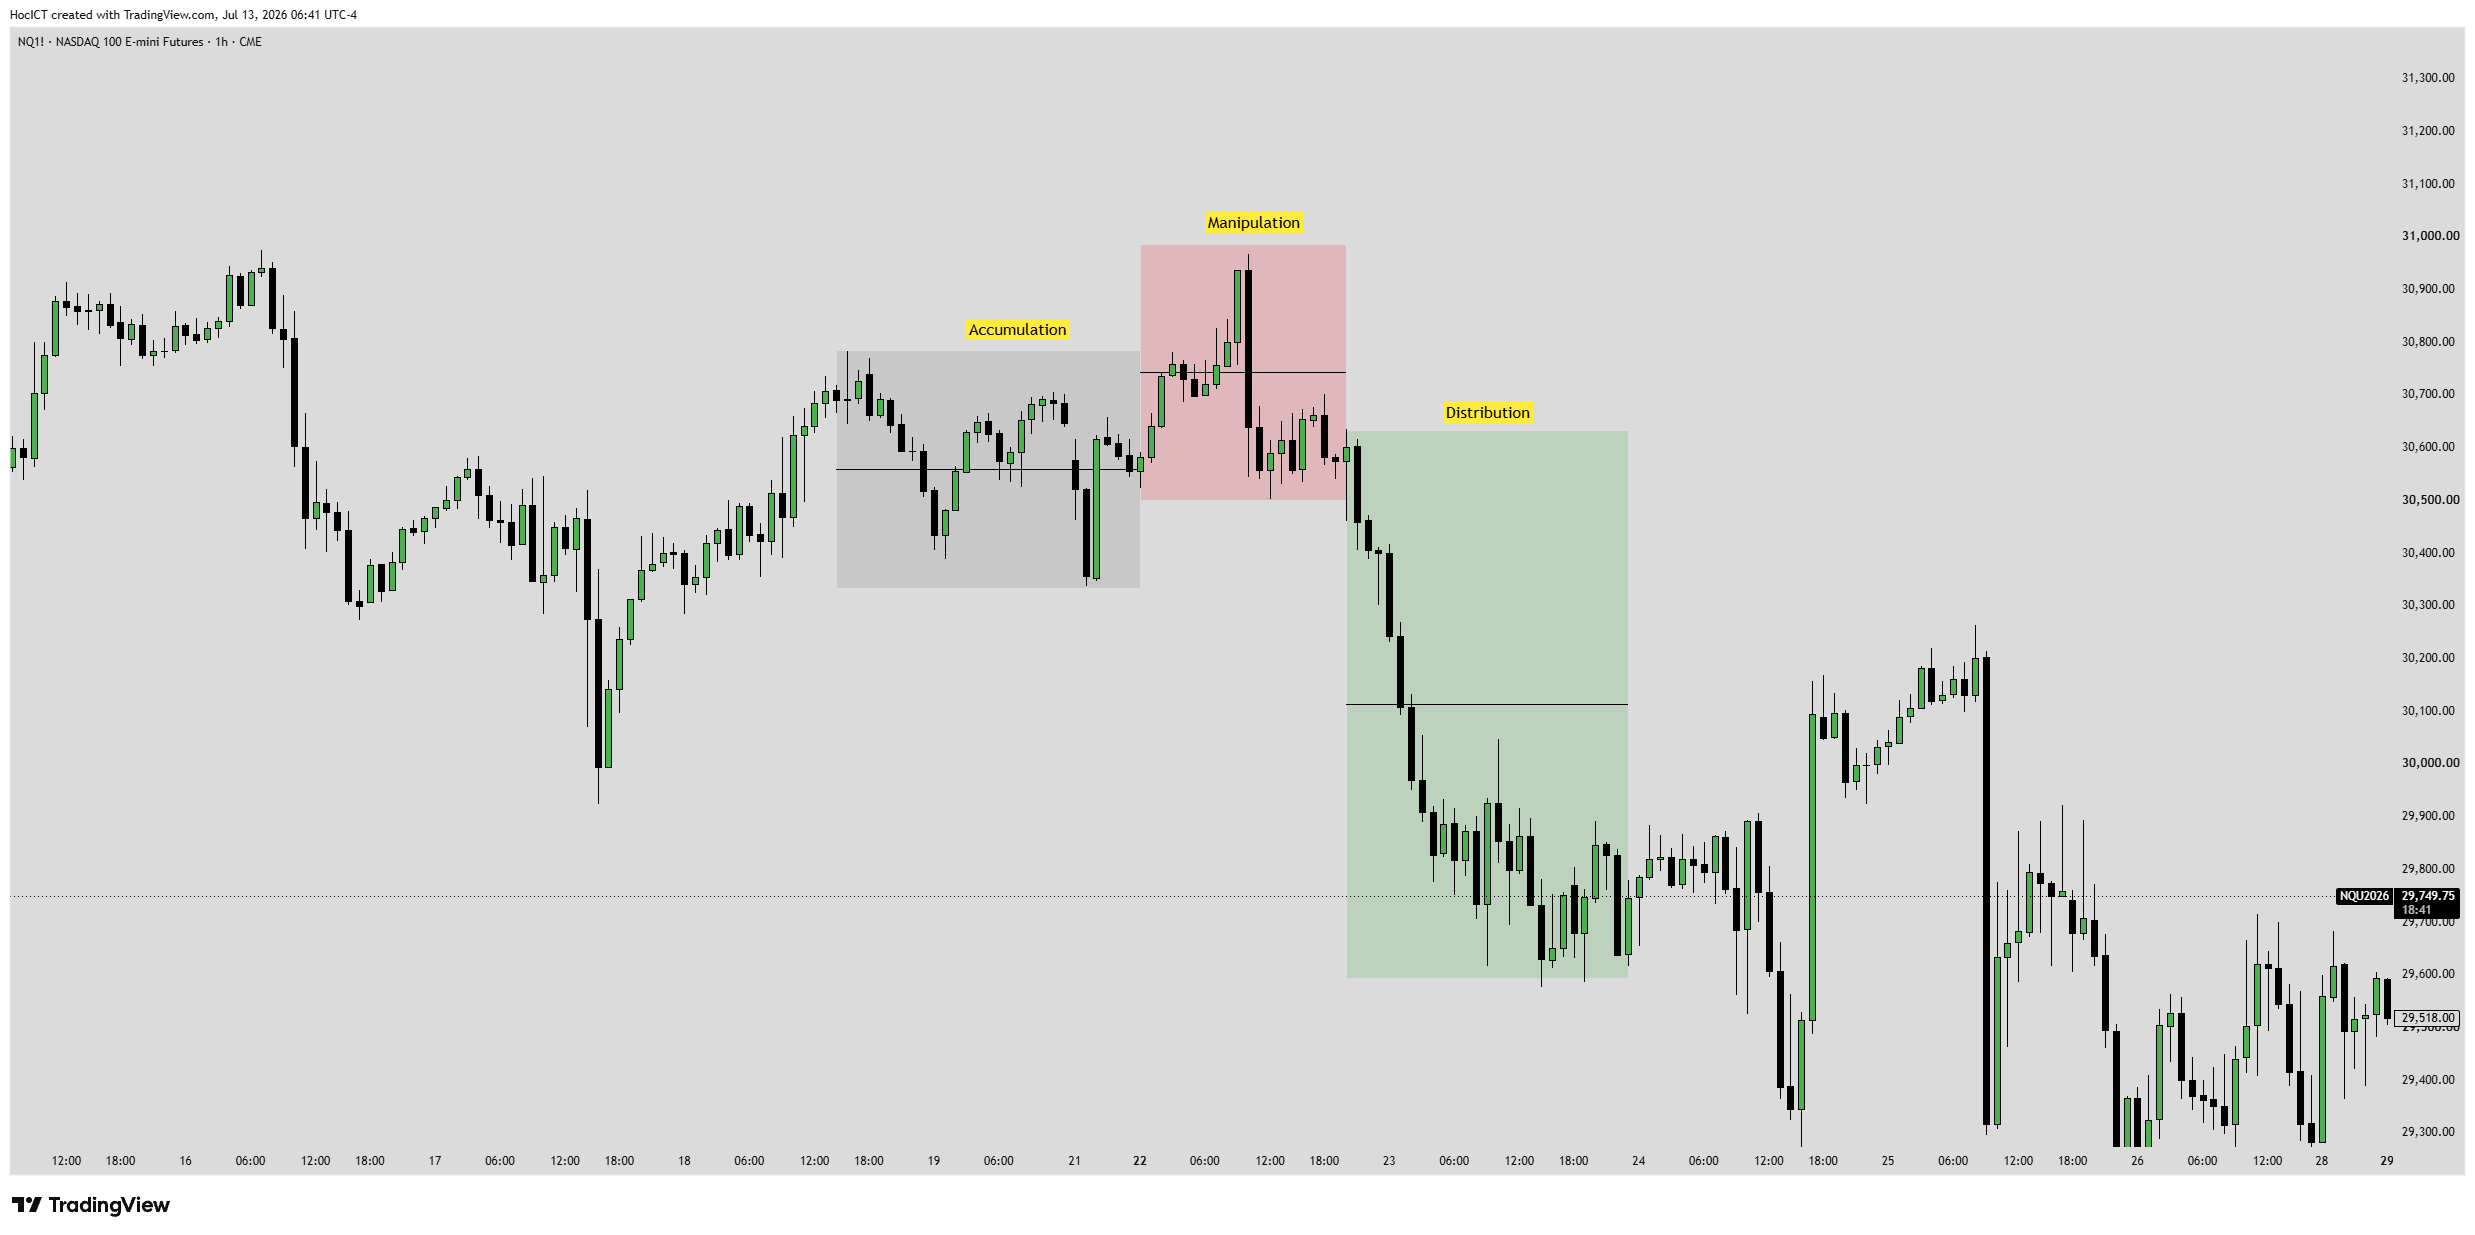
🔍 Institutional Accumulation - Manipulation - Distribution Cycle (AMD)
AMD (Accumulation – Manipulation – Distribution) là cách ICT diễn giải cụ thể mô hình PO3 lên biểu đồ thực tế. Trong khi PO3 mang tính triết lý tổng quát, AMD cung cấp một quy trình thao tác kỹ thuật cụ thể để xác định từng pha và tìm kiếm điểm vào lệnh chính xác.
1. Ba Pha Của AMD Trên Biểu Đồ Thực Tế
📦 Pha 1 — Accumulation (Tích Lũy)
- Giá dao động trong một biên độ hẹp (Consolidation Zone), thường kéo dài trong phiên giao dịch châu Á (00:00 – 08:00 London).
- Khối lượng giao dịch thấp, nến nhỏ, không có hướng rõ ràng.
- Smart Money sử dụng pha này để âm thầm tích lũy vị thế mà không làm giá biến động.
- Cách nhận biết: Đo vùng high và low của phiên Á. Đây sẽ là tham chiếu cho pha tiếp theo.
⚡ Pha 2 — Manipulation (Thao Túng / Bẫy)
- Thường xảy ra vào đầu phiên London Open (08:00 – 09:30 London) hoặc đầu New York Open.
- Giá phá vỡ một cạnh của vùng Accumulation — nhưng đây là phá vỡ GIẢ.
- Nếu Bias là Bullish: Giá phá xuống dưới đáy vùng Á để quét SSL (Sell-Side Liquidity), sau đó lập tức đảo ngược mạnh trở lên.
- Nếu Bias là Bearish: Giá phá lên trên đỉnh vùng Á để quét BSL, sau đó đảo ngược giảm mạnh.
- Đây là điểm vào lệnh tối ưu — sau khi xác nhận Stop Hunt và MSS.
🚀 Pha 3 — Distribution (Phân Phối / Xu Hướng Thực)
- Sau khi Stop Hunt hoàn tất và MSS đã xuất hiện, giá bắt đầu di chuyển mạnh mẽ theo hướng Bias thực.
- Đây là giai đoạn Smart Money phân phối vị thế đã tích lũy vào tay nhỏ lẻ đang hoảng loạn.
- Giá thường di chuyển đến các mục tiêu BSL/SSL lớn trên khung H4 hoặc Daily.
- Giao dịch trong pha này có R:R cực cao vì điểm SL gần (ngay sau điểm MSS), TP xa.
Mô hình AMD Bearish hoàn chỉnh: Quét BSL → Sập xuống
2. Checklist Xác Nhận AMD Hợp Lệ
- Xác định Bias (hướng giao dịch) từ khung H4/Daily trước.
- Đo vùng biên độ Accumulation của phiên Á (High – Low).
- Chờ giá phá vỡ ngược chiều Bias để kích hoạt Stop Hunt (Manipulation).
- Tìm tín hiệu MSS trên M15/M5 sau khi Stop Hunt xảy ra.
- Vào lệnh theo hướng Bias thực sau khi MSS được xác nhận.
- Đặt SL ngay bên kia điểm Stop Hunt. TP tại BSL/SSL khung lớn.
🎯 THỰC HÀNH & KIỂM TRA NHANH
Trắc Nghiệm Kiến Thức: AMD Model: Mô hình giao dịch 3 pha hoàn chỉnh theo ICT
Trả lời 3 câu hỏi trắc nghiệm thực chiến để củng cố kiến thức vừa học.
1
Điều kiện nào sau đây là BẮT BUỘC để một Order Block (OB) được coi là hợp lệ?
2
Khi sử dụng công cụ Fibonacci OTE (Optimal Trade Entry), mốc tỷ lệ nào được coi là "Sweet Spot" tối ưu nhất?
3