Goldbach Time: Lý Thuyết Đối Xứng Thời Gian Trong ICT
🔍 Goldbach Time Theory: Temporal Symmetry Reversal
Trong phân tích kỹ thuật truyền thống, hầu hết các nhà giao dịch chỉ tập trung vào trục giá (Price) như hỗ trợ, kháng cự, hay các chỉ báo kỹ thuật, mà hoàn toàn bỏ qua trục thời gian (Time). Goldbach Time (Lý Thuyết Đối Xứng Thời Gian) là một học thuyết cốt lõi trong phương pháp ICT, giúp giải thích cách thuật toán IPDA (Interbank Price Delivery Algorithm) vận hành và phân phối giá dựa trên các nhịp đối xứng thời gian cố định. Học thuyết này khẳng định rằng: "Thời gian phải đến trước, hành động giá mới theo sau" (Time first, then Price).
1. Ba Mốc Thời Gian Tham Chiếu Cốt Lõi (NY Time Anchors)
Để xác định các điểm đối xứng thời gian, thuật toán IPDA sử dụng các mốc tham chiếu thời gian New York (EST) làm điểm neo (Anchor points). Mọi chu kỳ đối xứng trong ngày đều bắt đầu hoặc xoay quanh các mốc này:
🕰️ 00:00 Midnight NY
Điểm mở cửa ngày mới của New York. Đây là điểm khởi đầu (Origin) để đo lường các nhịp tích lũy (Accumulation) và các chu kỳ đối xứng thời gian tiếp theo trong ngày.
⚡ 02:00 - 05:00 AM NY
Khung giờ mở cửa phiên London (London Open Killzone). Thường là nơi thuật toán tạo ra nhịp thao túng (Judas Swing) quét thanh khoản trước khi đi vào xu hướng thực.
🇺🇸 08:30 AM NY
Thời điểm công bố tin tức kinh tế quan trọng của Mỹ và mở cửa thị trường chứng khoán. Là điểm hội tụ thanh khoản và khởi đầu cho nhịp phân phối phiên Mỹ.
2. Hai Nguyên Lý Đối Xứng Thời Gian Căn Bản
Thuật toán IPDA phân phối các nhịp sóng của thị trường tuân theo hai nguyên lý đối xứng thời gian chính:
1 📐 Đối Xứng Tuyến Tính (Linear Time Symmetry - Tỷ lệ 1:1)
Nếu một nhịp đẩy xu hướng (Expansion) trước đó kéo dài trong một khoảng thời gian là T₁, thì nhịp điều chỉnh (Retracement) hoặc nhịp phân phối đối xứng tiếp theo cũng sẽ có xu hướng kéo dài trong một khoảng thời gian T₂ xấp xỉ bằng T₁ trước khi đảo chiều.
Ví dụ thực chiến: Nếu nhịp Judas Swing (thao túng) quét thanh khoản ở phiên London diễn ra trong đúng 3 tiếng (từ 02:00 đến 05:00 AM NY), thì nhịp đẩy xu hướng tiếp theo ở phiên New York thường sẽ chạy mạnh mẽ trong khoảng 3 tiếng đối xứng trước khi bắt đầu chững lại hoặc đảo chiều.
2 ⏰ Đối Xứng Tỷ Lệ Fibonacci Thời Gian (Fibonacci Time Zones)
Khoảng thời gian điều chỉnh hoặc tích lũy có xu hướng liên quan mật thiết với nhịp đẩy chính theo các tỷ lệ Fibonacci thời gian phổ biến như 0.382, 0.5, 0.618, 1.0, 1.618.
Khi bạn đo khoảng thời gian từ đáy đến đỉnh của một nhịp tăng mạnh bằng công cụ Fibonacci Time Zones, các mốc 0.618 hoặc 1.0 thời gian sẽ chỉ ra thời điểm mà thị trường dễ xảy ra đảo chiều nhất.
Biểu đồ đối xứng thời gian 1:1 từ Midnight NY Open
3. Cách Sử Dụng Điểm Neo Thuật Toán (Algorithmic Anchor Points)
Điểm neo thuật toán (Algorithmic Anchor Point) là các mốc thời gian hoặc mức giá quan trọng được thuật toán IPDA sử dụng làm "vạch xuất phát" để tính toán các chu kỳ thời gian và biên độ dao động tiếp theo.
📌 Điểm Neo Thời Gian (Time Anchor)
Là các Swing High/Swing Low quan trọng hoặc các điểm mở cửa (Midnight, Session Open). Thuật toán sẽ đếm số lượng nến (Time Cycles) từ điểm neo này để xác định các nhịp đối xứng (ví dụ: chu kỳ 17 nến, 14 nến, và vùng đảo chiều 47/50 nến).
📌 Điểm Neo Giá (Price Anchor)
Là các vùng giá trị đặc biệt được thuật toán thiết lập từ trước như NDOG (New Daily Opening Gap) hoặc NWOG (New Weekly Opening Gap). Các khoảng trống giá này đóng vai trò như nam châm thu hút giá (Draw on Liquidity) và là bệ đỡ hỗ trợ/kháng cự cực mạnh.
Phân tích thực chiến Goldbach Time trên NQ1!:
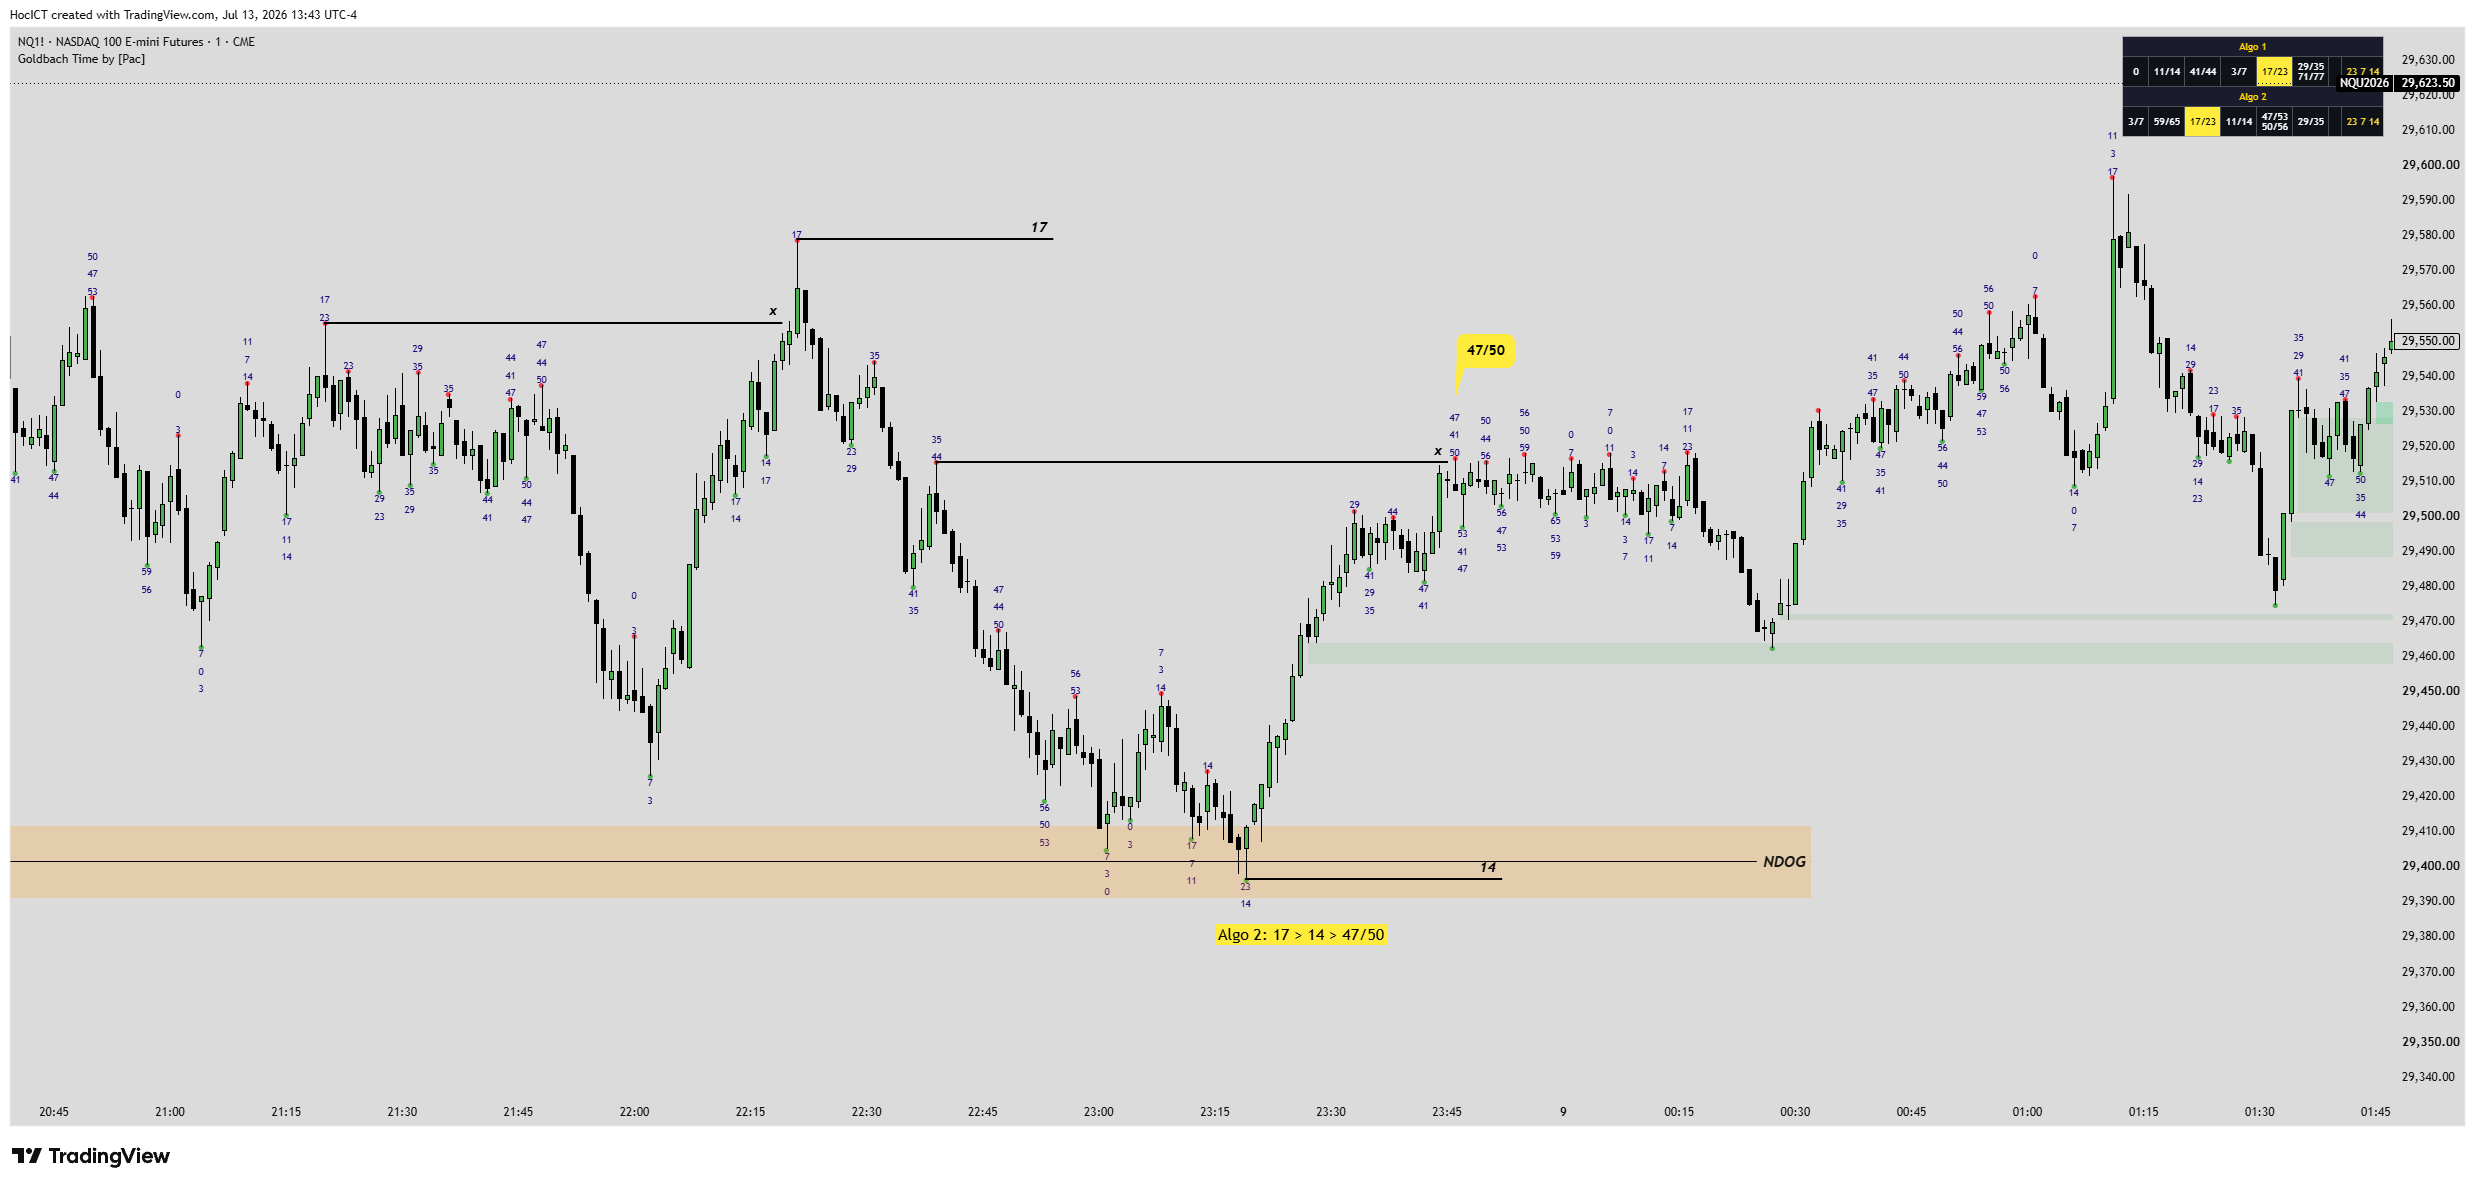
📷 Biểu đồ NQ1! thực chiến: Sự hội tụ giữa chu kỳ Goldbach Time (Algo 2) và điểm neo giá NDOG.
Dựa trên biểu đồ thực chiến của chỉ số Nasdaq 100 Futures (NQ1!) ở trên, chúng ta có thể thấy rõ cách thuật toán IPDA phối hợp giữa Thời Gian (Time) và Mức Giá (Price):
- Đếm chu kỳ đối xứng (Algo 2: 17 > 14 > 47/50): Từ điểm neo Swing High ban đầu, thuật toán di chuyển theo chu kỳ thứ nhất dài 17 nến, tiếp theo là chu kỳ thứ hai dài 14 nến. Dựa trên thuật toán đếm chu kỳ của Algo 2, vùng thời gian từ nến thứ 47 đến 50 được xác định là cửa sổ thời gian đảo chiều (Time Window).
- Hội tụ tại Điểm Neo Giá (NDOG): Vùng màu cam ở giá 29,400 chính là NDOG (New Daily Opening Gap). Khi giá rơi mạnh về đúng vùng NDOG này, đồng thời trục thời gian chạm vào cửa sổ 47/50 nến, sự hội tụ này kích hoạt hành vi đảo chiều tăng mạnh mẽ.
- Các mục tiêu chốt lời (Targets): Khi lệnh mua được kích hoạt tại điểm neo giá NDOG, các đỉnh cũ ngắn hạn (được biểu diễn bằng các đường ngang đen phía trên) chính là các điểm thanh khoản mục tiêu của thuật toán IPDA.
4. Sự Hội Tụ Giữa Giá Và Thời Gian (Price + Time Confluence)
Nguyên tắc tối thượng trong ICT là không bao giờ giao dịch đơn độc bằng thời gian hoặc giá. Điểm đảo chiều có xác suất thắng cao nhất xuất hiện khi trục Thời gian hội tụ đồng thời với trục Giá tại các vùng kháng cự/hỗ trợ thuật toán:
Hội tụ Giá (Price POI): Giá chạm vào một khối lệnh Order Block (OB), khối phá vỡ Breaker Block, hoặc lấp đầy khoảng trống giá trị hợp lý (FVG).
Hội tụ Thời gian (Time Window): Trục thời gian chạm đúng vào chu kỳ đối xứng Goldbach (ví dụ: thời điểm hiện tại chính là mốc đối xứng 1:1 của nhịp tích lũy trước đó, hoặc trùng khớp với cửa sổ thời gian ICT Macro / Silver Bullet).
5. Quy Trình 4 Bước Giao Dịch Thực Chiến Với Goldbach Time
Để áp dụng học thuyết đối xứng thời gian vào hệ thống giao dịch hàng ngày, hãy thực hiện theo check-list sau:
- Bước 1: Xác định điểm neo thời gian (Midnight NY). Đánh dấu mốc 00:00 NY trên biểu đồ của bạn làm vạch xuất phát đo lường thời gian cho ngày giao dịch.
- Bước 2: Đo lường khoảng thời gian của sóng đầu tiên (T₁). Ví dụ, đo khoảng thời gian từ Midnight đến đỉnh cao nhất của phiên London (London High).
- Bước 3: Chiếu nhịp đối xứng (T₂ = T₁). Dự báo thời điểm kết thúc sóng hồi hoặc đảo chiều ở phiên Mỹ bằng cách cộng thêm khoảng thời gian T₁ từ đỉnh London.
- Bước 4: Đợi xác nhận tại POI giá. Khi thời gian đếm ngược T₂ chạm mốc, hãy quan sát xem giá có đang nằm ở vùng FVG hoặc OB hay không. Nếu có phản ứng từ chối giá (Rejection) và đảo chiều cấu trúc (MSS/MSS), tiến hành mở lệnh giao dịch ngay lập tức.
Trắc Nghiệm Kiến Thức: Goldbach Time: Lý Thuyết Đối Xứng Thời Gian Trong ICT
Trả lời 3 câu hỏi trắc nghiệm thực chiến để củng cố kiến thức vừa học.