SMT Divergence: Sự phân kỳ dòng tiền thông minh
🔍 SMT Divergence: Intermarket Smart Money Accumulation
SMT Divergence (Smart Money Tool) là hiện tượng phân kỳ tương quan giữa hai sản phẩm tài chính có mối quan hệ đồng thuận cao (ví dụ: các chỉ số chứng khoán NQ và ES, hoặc các cặp tiền EUR/USD và GBP/USD). Đây là một trong những công cụ tối thượng trong lý thuyết ICT giúp phát hiện hành vi tích lũy (gom hàng) hoặc phân phối (xả hàng) ẩn của Smart Money trước khi thị trường đảo chiều mạnh mẽ.
1. Bản Chất Khoa Học Của SMT Divergence
Trong một thị trường hiệu quả, các tài sản cùng ngành hoặc chịu chung một tác động vĩ mô (chẳng hạn như cùng được định giá bằng đồng USD) bắt buộc phải chuyển động đồng pha. Khi một tài sản tạo đỉnh mới cao hơn hoặc đáy mới thấp hơn, tài sản tương quan mật thiết của nó cũng phải làm điều tương tự.
Tuy nhiên, khi thuật toán IPDA bắt đầu tích lũy hoặc phân phối khối lượng cực lớn, sự bất đối xứng sẽ xuất hiện:
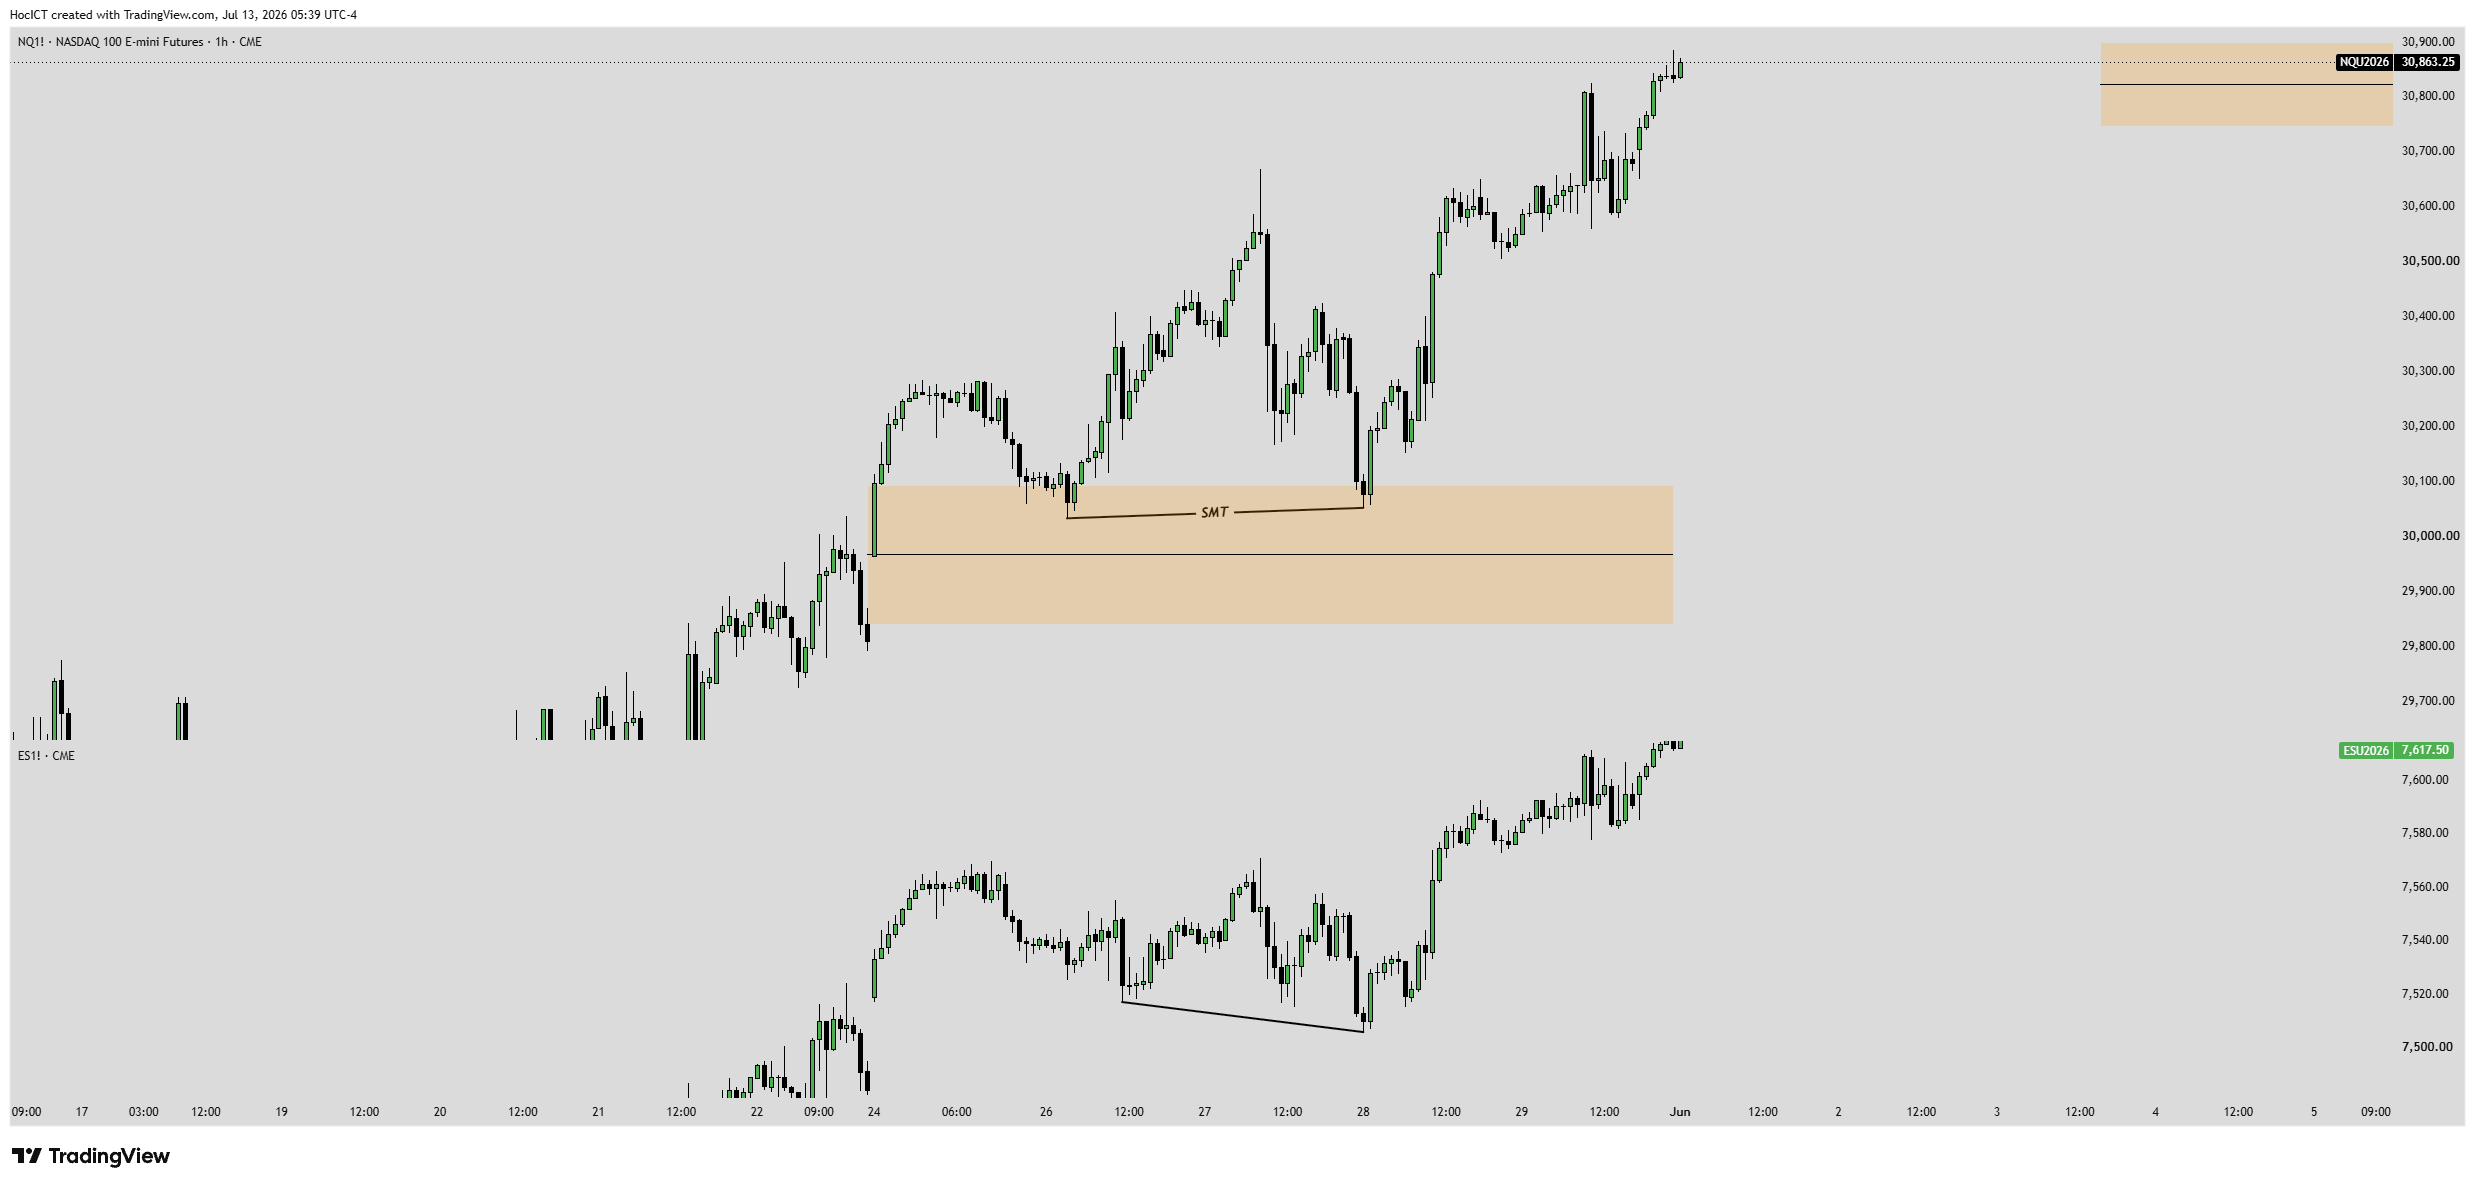
- Bullish SMT Divergence (Phân kỳ tăng giá): Trong một xu hướng giảm, Tài sản A giảm mạnh tạo Đáy Thấp Hơn (Lower Low). Nhưng Tài sản B lại thất bại trong việc phá đáy và chỉ tạo Đáy Cao Hơn (Higher Low). Điều này cho thấy dòng tiền lớn đang chủ động gom mua rất mạnh Tài sản B, đỡ giá không cho giảm sâu.
- Bearish SMT Divergence (Phân kỳ giảm giá): Trong một xu hướng tăng, Tài sản A tăng mạnh tạo Đỉnh Cao Hơn (Higher High). Nhưng Tài sản B lại thất bại trong việc vượt đỉnh và chỉ tạo Đỉnh Thấp Hơn (Lower High). Điều này cho thấy lực cung của Smart Money đang chặn đứng Tài sản B, chuẩn bị cho cú sập giá.
📷 Hình 12.1: Hiện tượng Bullish SMT Divergence giữa NQ1! (Nasdaq 100 - phía trên) và ES1! (S&P 500 - phía dưới) trên khung H1. NQ tạo đáy thấp hơn quét vào vùng OB/FVG, trong khi ES giữ chân tạo đáy cao hơn (SMT), xác nhận dòng tiền gom mua mạnh mẽ và đẩy giá đảo chiều tăng vọt sau đó.
2. Các Cặp Đồng Chất Tương Quan Mật Thiết
Để áp dụng SMT hiệu quả, trader bắt buộc phải so sánh giữa các cặp tài sản có độ tương quan mật thiết nhất (các cặp đồng chất):
📊 Chỉ số chứng khoán Mỹ: NQ1! (Nasdaq 100) & ES1! (S&P 500)
Đây là cặp so sánh phổ biến nhất. Nasdaq 100 (NQ) đại diện cho nhóm công nghệ có biến động nhạy bén và mạnh mẽ hơn, trong khi S&P 500 (ES) đại diện cho 500 doanh nghiệp đa ngành lớn nhất.
💡 Quy tắc thực chiến: Khi NQ quét đáy cũ tạo Lower Low nhưng ES giữ được đáy tạo Higher Low, hoặc ngược lại, đây là tín hiệu xác nhận cực mạnh cho các thiết lập Mua khung ngày hoặc khung giờ.
💱 Cặp tiền tệ chính: EUR/USD & GBP/USD
Cả Euro và Bảng Anh đều chuyển động ngược chiều với chỉ số Dollar Index (DXY). Tuy nhiên, do đặc thù kinh tế Anh và châu Âu khác nhau, dòng tiền lớn sẽ chọn một trong hai đồng tiền để gom/xả trước.
💡 Quy tắc thực chiến: Nếu EUR/USD đâm thủng đáy cũ (quét râu thanh khoản SSL) nhưng GBP/USD lại tạo đáy cao hơn một cách rõ rệt, điều đó khẳng định đồng Bảng Anh đang nhận được lực đỡ mạnh mẽ của tổ chức. Cả hai sẽ sớm đảo chiều bay lên.
🪙 Thị trường kim loại quý: XAU/USD (Vàng) & XAG/USD (Bạc)
Vàng và Bạc là hai kim loại quý có mối quan hệ tương quan đồng thuận cực kỳ chặt chẽ. Tuy nhiên, Vàng có tính trú ẩn an toàn cao hơn và vốn hóa lớn hơn, trong khi Bạc có tính ứng dụng công nghiệp lớn và độ biến động (Beta) cao hơn.
💡 Quy tắc thực chiến: Khi Vàng quét đáy cũ (Lower Low) do áp lực bán tháo, nhưng Bạc lại từ chối giảm tiếp và tạo đáy cao hơn (Higher Low), sự phân kỳ SMT này cho thấy lực gom hàng Bạc rất mạnh và cả hai kim loại quý chuẩn bị bước vào một nhịp tăng mạnh mẽ.
🪙 Thị trường Crypto: BTC/USD & ETH/USD
Bitcoin và Ethereum dẫn dắt toàn bộ thị trường tiền điện tử. Khi có sự phân cực dòng tiền:
💡 Quy tắc thực chiến: Trong pha điều chỉnh giảm của Crypto, nếu BTC/USD phá đáy cũ để quét thanh khoản nhưng ETH/USD lại đứng vững và tạo đáy cao hơn, SMT này báo hiệu lực cầu gom hàng Altcoin đã bắt đầu hoạt động, thị trường chuẩn bị phục hồi.
💵 Chỉ số Sức mạnh Dollar: DXY vs EUR/USD (hoặc GBP/USD)
Vì DXY đại diện cho USD, chuyển động của nó sẽ nghịch chiều hoàn toàn với EUR/USD.
💡 Quy tắc thực chiến (SMT nghịch chiều): Nếu chỉ số DXY tăng mạnh phá đỉnh cũ tạo Higher High, nhưng cặp EUR/USD lại không thể phá đáy cũ tạo Lower Low (chỉ tạo đáy cao hơn), sự lệch pha này báo hiệu Dollar đã bị kiệt lực đẩy và EUR/USD chuẩn bị có đà tăng rất mạnh.
3. Quy Tắc Giao Dịch Thực Chiến Với SMT Divergence
- Không giao dịch SMT độc lập: SMT Divergence chỉ là một bộ lọc xác nhận bổ sung (Confluence). Bạn chỉ nên tìm kiếm SMT khi giá của một trong hai tài sản đã tiếp cận đến vùng POI quan trọng (như OB, FVG khung lớn H4/D1) hoặc quét thanh khoản đỉnh/đáy chính (Liquidity Sweep).
- Lựa chọn tài sản để vào lệnh (Entry Selection):
- Tài sản tạo SMT (Đáy cao hơn / Đỉnh thấp hơn): Đây là tài sản khỏe hơn (khi mua) hoặc yếu hơn (khi bán). Nó sẽ có tốc độ tăng/giảm nhanh hơn và mạnh mẽ hơn vì lực gom/xả của dòng tiền lớn tập trung trực tiếp vào đây.
- Tài sản quét thanh khoản (Đáy thấp hơn / Đỉnh cao hơn): Đây là tài sản có điểm dừng lỗ (Stop Loss) an toàn hơn, vì nó đã thực hiện pha quét Stop Hunt sạch sẽ của nhỏ lẻ trước khi đi. - Xác nhận khung nhỏ: Sau khi phát hiện SMT tại POI khung lớn, hãy chuyển xuống khung thời gian nhỏ hơn (như 1m/5m) chờ đợi một cấu trúc dịch chuyển MSS rõ ràng đi kèm FVG để mở vị thế giao dịch.
Trắc Nghiệm Kiến Thức: SMT Divergence: Sự phân kỳ dòng tiền thông minh
Trả lời 3 câu hỏi trắc nghiệm thực chiến để củng cố kiến thức vừa học.