STDV — Standard Deviation: Đo độ lệch chuẩn mục tiêu giá
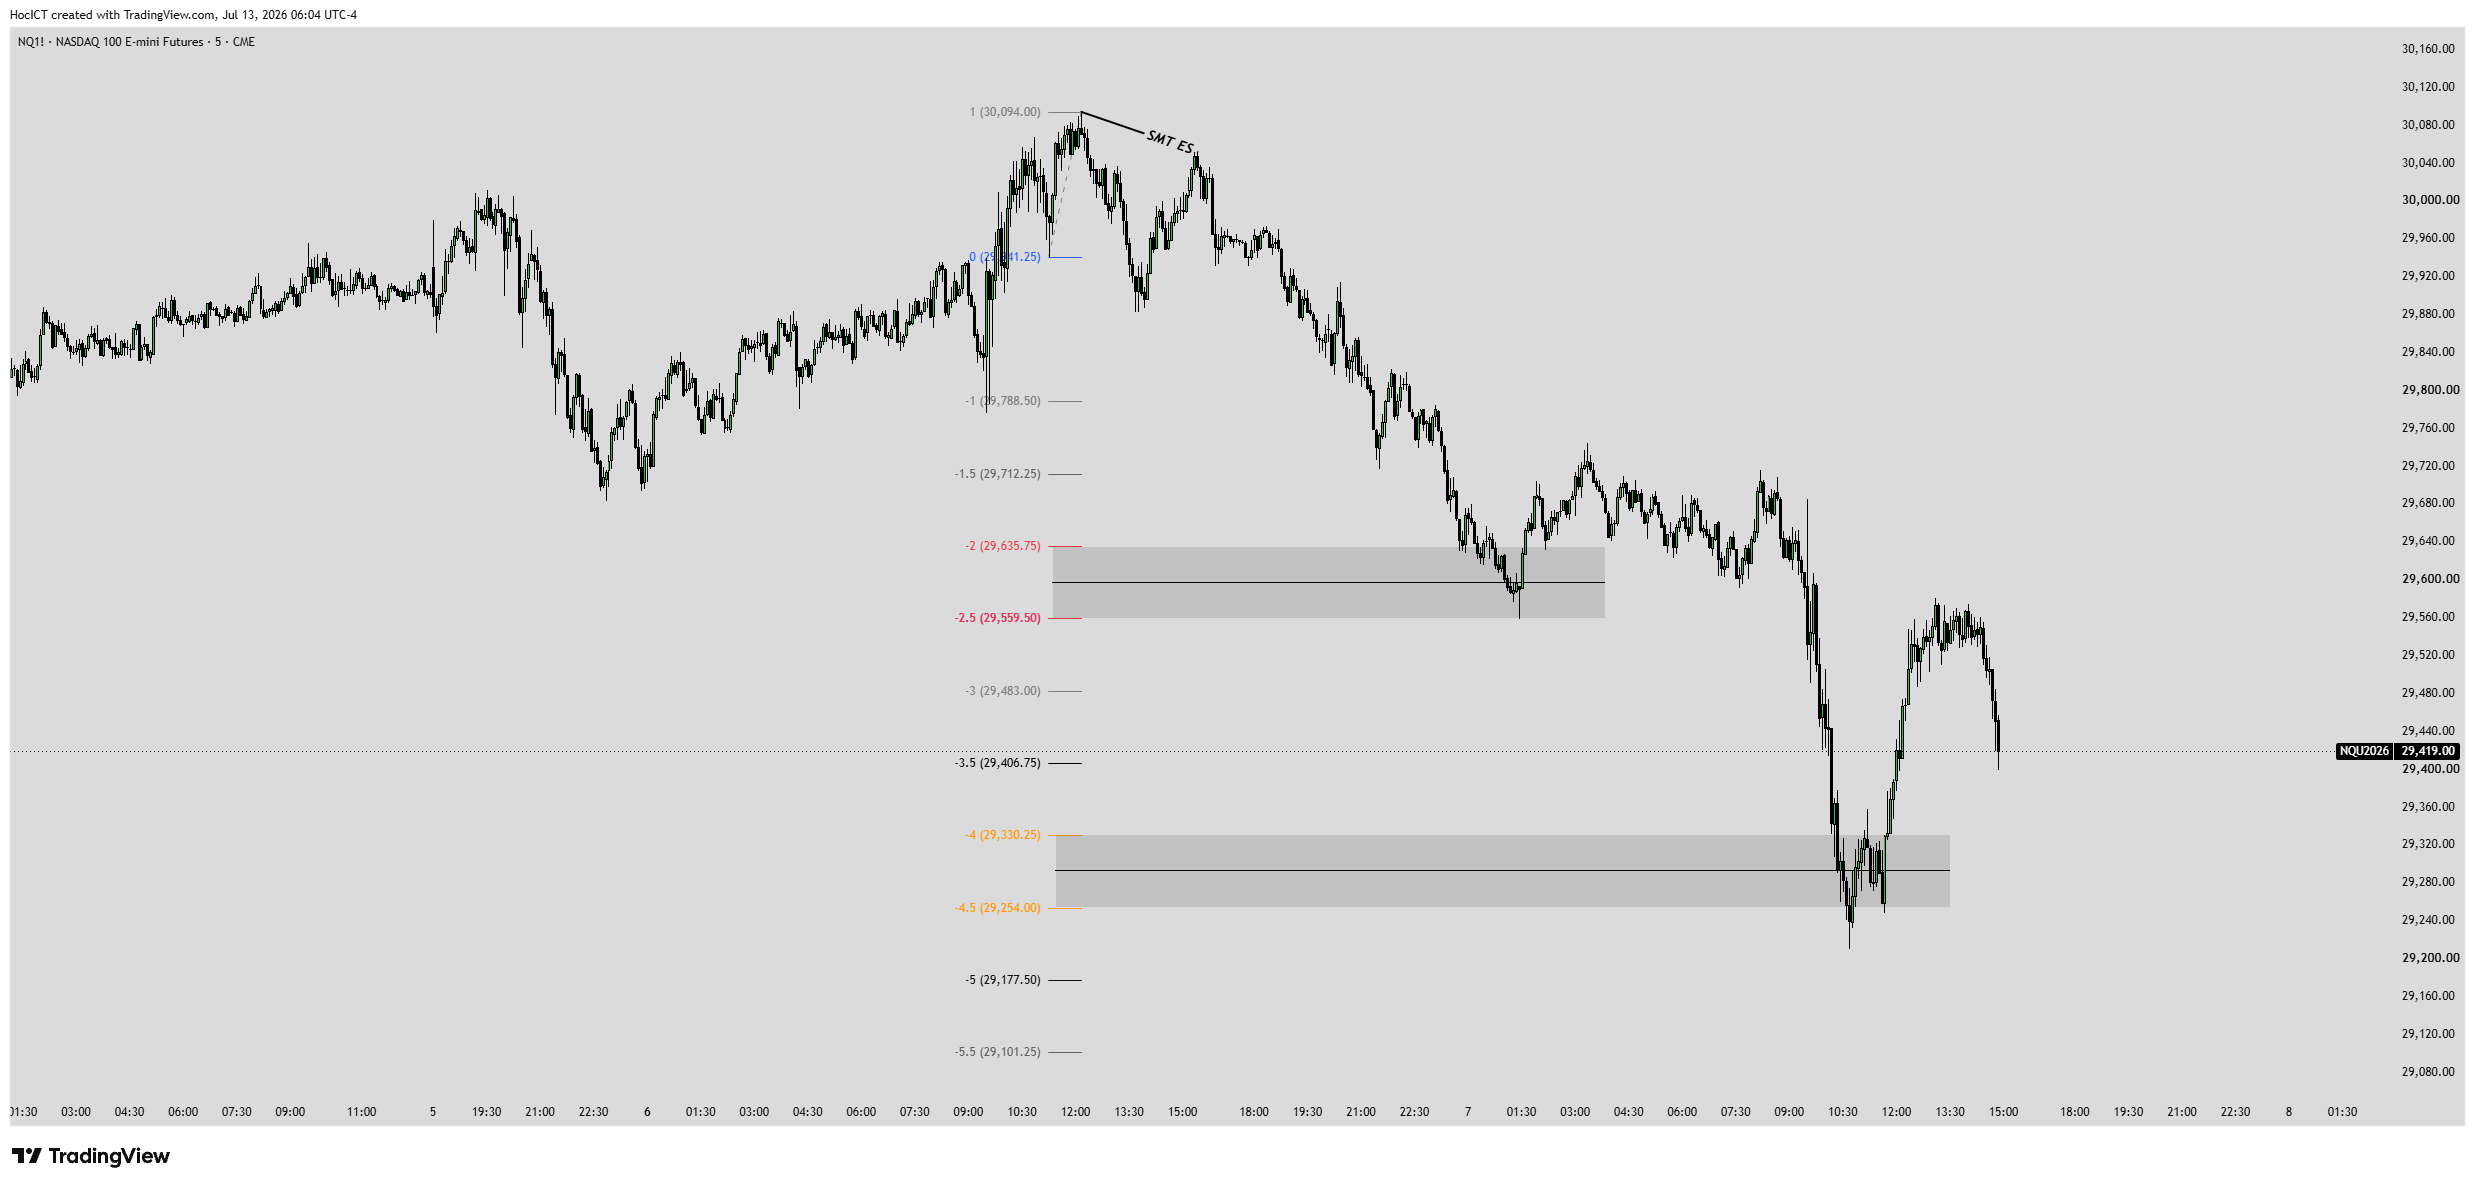
🔍 Standard Deviation (STDV) Target Projections
Standard Deviation (STDV - Độ lệch chuẩn) trong phương pháp ICT không phải là chỉ báo thống kê truyền thống trên các sàn giao dịch. Thay vào đó, đây là công cụ đo lường **các bước nhảy biên độ mục tiêu** của thuật toán IPDA (Interbank Price Delivery Algorithm). Nó cho phép trader xác định cực kỳ chính xác các điểm chốt lời (TP) tiềm năng và các vùng đảo chiều có xác suất thắng cao nhất dựa trên toán học đối xứng.
1. Nguyên Lý Đo STDV Bằng Công Cụ Fibonacci
Để xác định các mức STDV trên biểu đồ, trader sử dụng công cụ **Fibonacci Retracement** đo vẽ từ đỉnh đến đáy của **nhịp thao túng / quét thanh khoản (Judas Swing)**. Các mốc cài đặt Fibonacci mở rộng âm (hoặc dương tùy theo hướng đo) sẽ đóng vai trò là các bước nhảy độ lệch chuẩn:
- 0.0 đến -1.5 STDV: Vùng phân phối sớm. Giá dễ dàng đạt được trong hầu hết các phiên giao dịch.
- -2.0 đến -2.5 STDV: Vùng mục tiêu tiêu chuẩn & đảo chiều (Standard Target & Reversal Zone). Đây là vùng chốt lời chính của các tổ chức lớn trong các ngày giao dịch thông thường.
- -4.0 đến -4.5 STDV: Vùng mục tiêu mở rộng (Extended Distribution Zone). Giá chỉ tiếp cận vùng này trong những ngày thị trường đi xu hướng cực mạnh (Trend Days) hoặc có tin tức vĩ mô chấn động (CPI, FOMC, Non-farm).
📷 Hình 13.1: Các mức mục tiêu độ lệch chuẩn STDV thực tế trên biểu đồ Nasdaq 5 phút. Giá phản ứng tại vùng đảo chiều tiêu chuẩn -2 đến -2.5, nhưng sau khi phá vỡ dứt khoát, thuật toán tiếp tục phân phối giá xuống thẳng vùng mục tiêu mở rộng -4 đến -4.5.
2. Quy Tắc Thân Nến Quyết Định: Sự Khác Biệt Giữa Đảo Chiều Và Tiếp Diễn Phân Phối
⭐ QUY TẮC CỐT LÕI CỦA MICHAEL J. HUDDLESTON:
Hành vi của giá khi tiếp cận vùng -2.0 đến -2.5 STDV sẽ quyết định kịch bản giao dịch tiếp theo:
-
Kịch bản Đảo chiều (Reversal) tại -2.0 đến -2.5 STDV:
Giá quét râu qua vùng này nhưng thân nến không thể đóng cửa bên ngoài mức -2.5 (rút chân mạnh mẽ tạo râu nến dài). Điều này xác nhận sự từ chối giá (Rejection) của Smart Money. Thuật toán đã hoàn tất phân phối và bắt đầu đảo chiều xu hướng. Bạn có thể tìm lệnh giao dịch ngược chiều. -
Kịch bản Tiếp diễn Phân phối (Extended Distribution) đến -4.0 đến -4.5 STDV:
Nếu xuất hiện nến thân lớn đóng cửa dứt khoát vượt qua (nằm ngoài) mức -2.5 STDV, thuật toán đảo chiều hoàn toàn bị vô hiệu hóa. Thuật toán IPDA lúc này xác nhận động lượng xu hướng cực lớn và sẽ tiếp tục đẩy giá phân phối sang vùng mục tiêu đối xứng mở rộng tiếp theo là -4.0 đến -4.5 STDV.
3. Tại Sao Lại Có Hiện Tượng Phân Phối Tiếp Diễn Đến -4.0 / -4.5 STDV?
Cơ chế vận hành của thuật toán IPDA đằng sau quy tắc này được giải thích như sau:
- Hấp thụ hoàn toàn lực cản: Vùng -2.0 đến -2.5 STDV là nơi tập trung rất nhiều lệnh giới hạn (Limit Orders) đối ứng của các tổ chức khác để chặn đà rơi/tăng của giá. Khi thân nến đóng cửa vượt qua -2.5, điều đó chứng tỏ lực đẩy của dòng tiền lớn dẫn dắt đã hấp thụ hoàn toàn (clean sweep) các cản này mà không gặp bất kỳ lực cản đáng kể nào.
- Mất cân bằng cung cầu nghiêm trọng: Việc đóng nến ngoài -2.5 xác nhận trạng thái mất cân bằng một chiều cực độ. Thuật toán IPDA bắt buộc phải tiếp tục tìm kiếm vùng thanh khoản lớn hơn ở xa hơn (nơi các tổ chức đặt lệnh dừng lỗ hoặc lệnh chờ lớn tiếp theo) nằm tại mốc đối xứng toán học tiếp theo là -4.0 đến -4.5 STDV.
- Sự đồng thuận đa khung thời gian (HTF Confluence): Thông thường, khi giá chạy đến -4.0 đến -4.5 STDV trên khung thời gian nhỏ, nó sẽ trùng khớp hoàn toàn với một vùng POI (OB hoặc FVG) cực mạnh trên khung thời gian lớn (H4/Daily).
Trắc Nghiệm Kiến Thức: STDV — Standard Deviation: Đo độ lệch chuẩn mục tiêu giá
Trả lời 3 câu hỏi trắc nghiệm thực chiến để củng cố kiến thức vừa học.